What is the average depth and magnitude of earthquakes by time zone?
Content:

One of the challenges a Data Analyst faces when working with data is understanding the different types of data and how to work with them correctly. This document aims to showcase python’s work with dates, times, and time zones. That is important, especially with data sets containing dates and times from worldwide regions. Sometimes we need to analyze all the information within the same Time Zone (Universal Time) to have the same point of comparison.
About the data set
For this analysis, I used the data set “Significant Earthquakes, 1965-2016.”
The variables used for this analysis were:
- Date: The date of the earthquake in the format DD/MM/YYYY *
- Time: The time of the earthquake in the format HH/MM/SS. *
- Latitude: The Latitude point where the earthquake occurred.
- Longitude: The Longitude point where the earthquake occurred.
- Depth: It can be read as the distance between the epicentre and the seismograph station
- Magnitude: A magnitude is a number that characterizes the relative size of an earthquake. Magnitude is based on the measurement of the maximum motion recorded by a seismograph.
* The date and time in this original date set are represented using the Coordinated Universal Time (UTC). However, for this document, we will imagine that the date and time are reported in the local time from the earthquake.
Package used
For this analysis the following packaged were used:
					## For Manipulation data and calculations
import pandas as pd
import numpy as np

# For Working with dates and time
from timezonefinder import TimezoneFinder
import pytz
from datetime import datetime

## For visualization
import matplotlib as mpl
import matplotlib.pyplot as plt
import seaborn as sns
from textwrap import wrap
from mpl_toolkits.axes_grid1.inset_locator import inset_axes
from matplotlib.cm import ScalarMappable
from matplotlib.lines import Line2D
Data Preparation
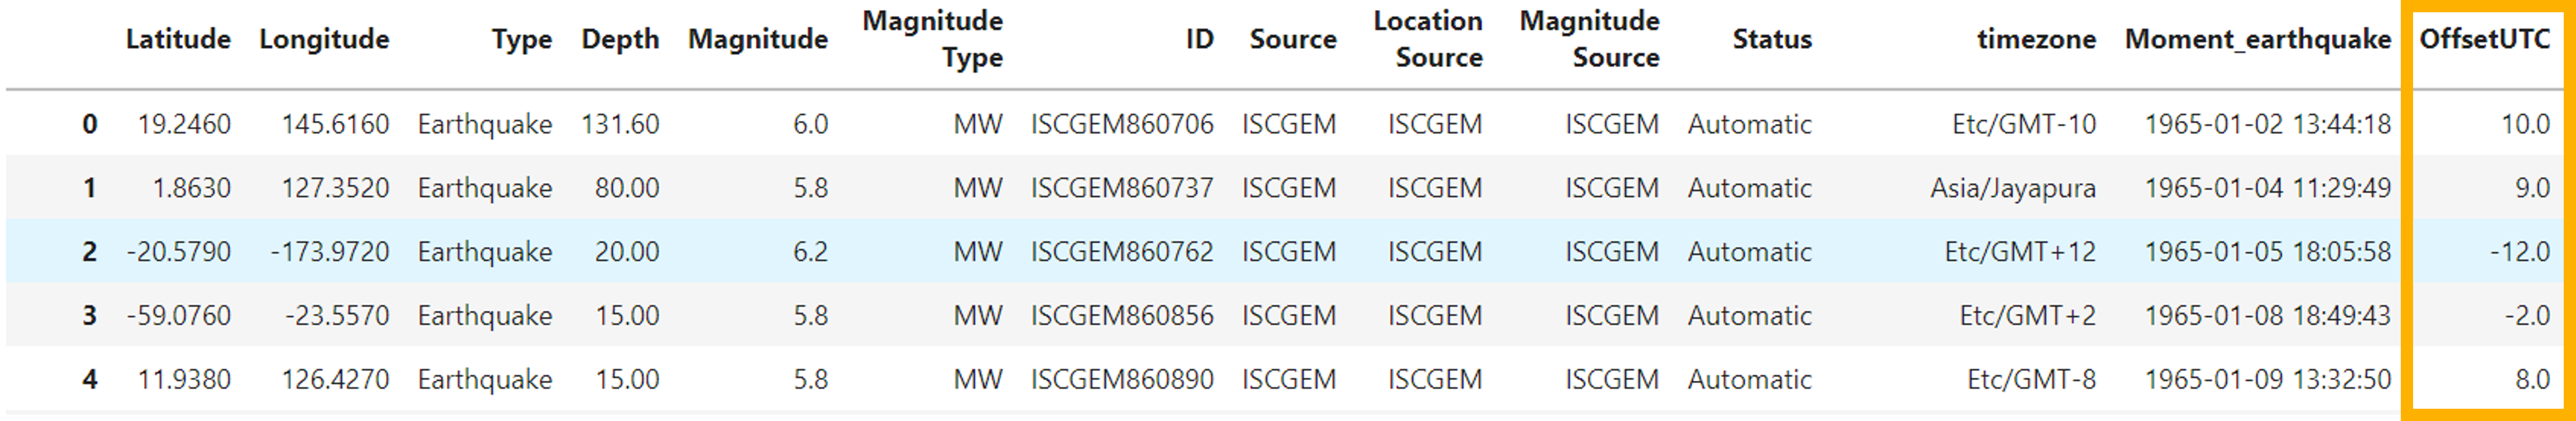
To better understand the values in each variable, let’s see the first five records of the data set.
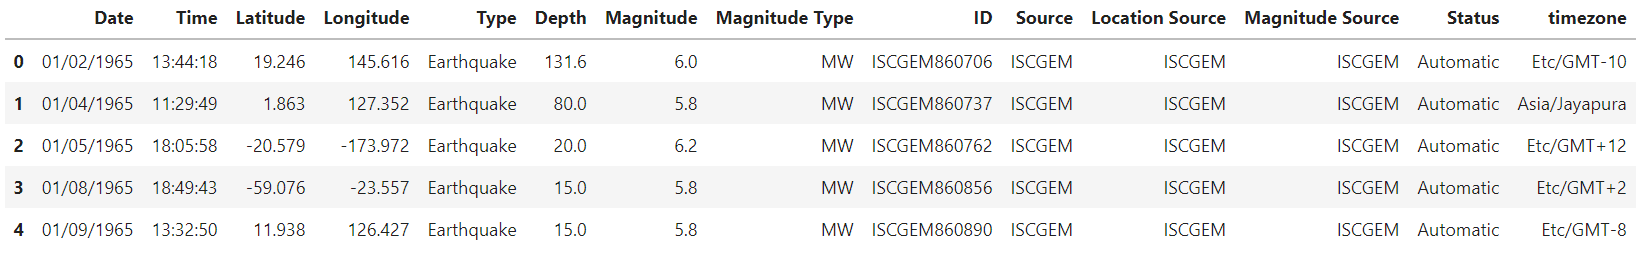
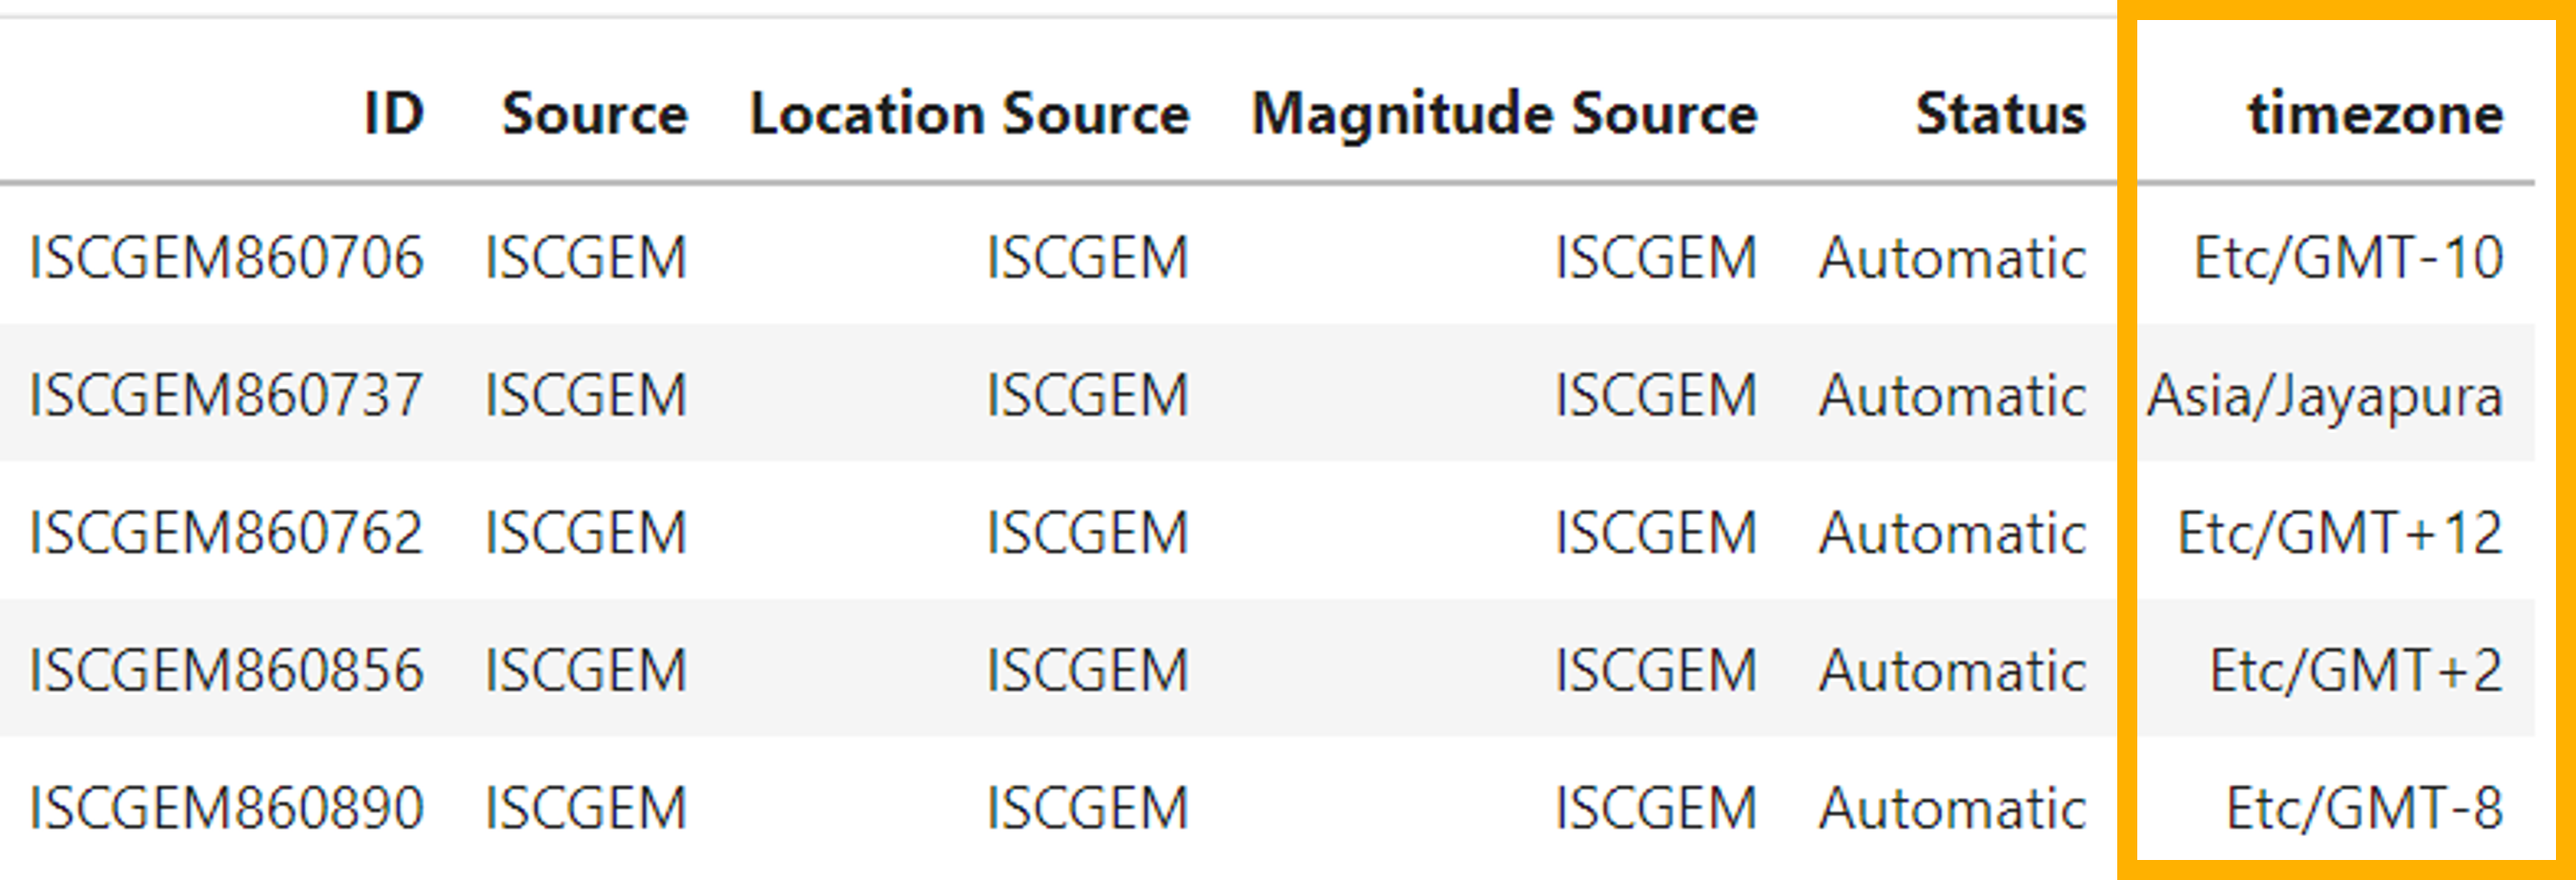
As it can be observed, the dataset doesn’t have a variable related to the time zone. We aim to convert all dates and times to the Coordinated Universal Time (UTC). To do that, we can use Latitude and Longitude to identify the time zone in that location. This step is easy to do. It just requires the TimeZoneFinde module in python. Using the following code, we are adding a new column identifying the time zone based on the Latitude and Longitude.
					my_func = TimezoneFinder().timezone_at
df['timezone'] = df.apply(lambda x: my_func(lng=x['Longitude'], lat=x['Latitude']),axis=1)
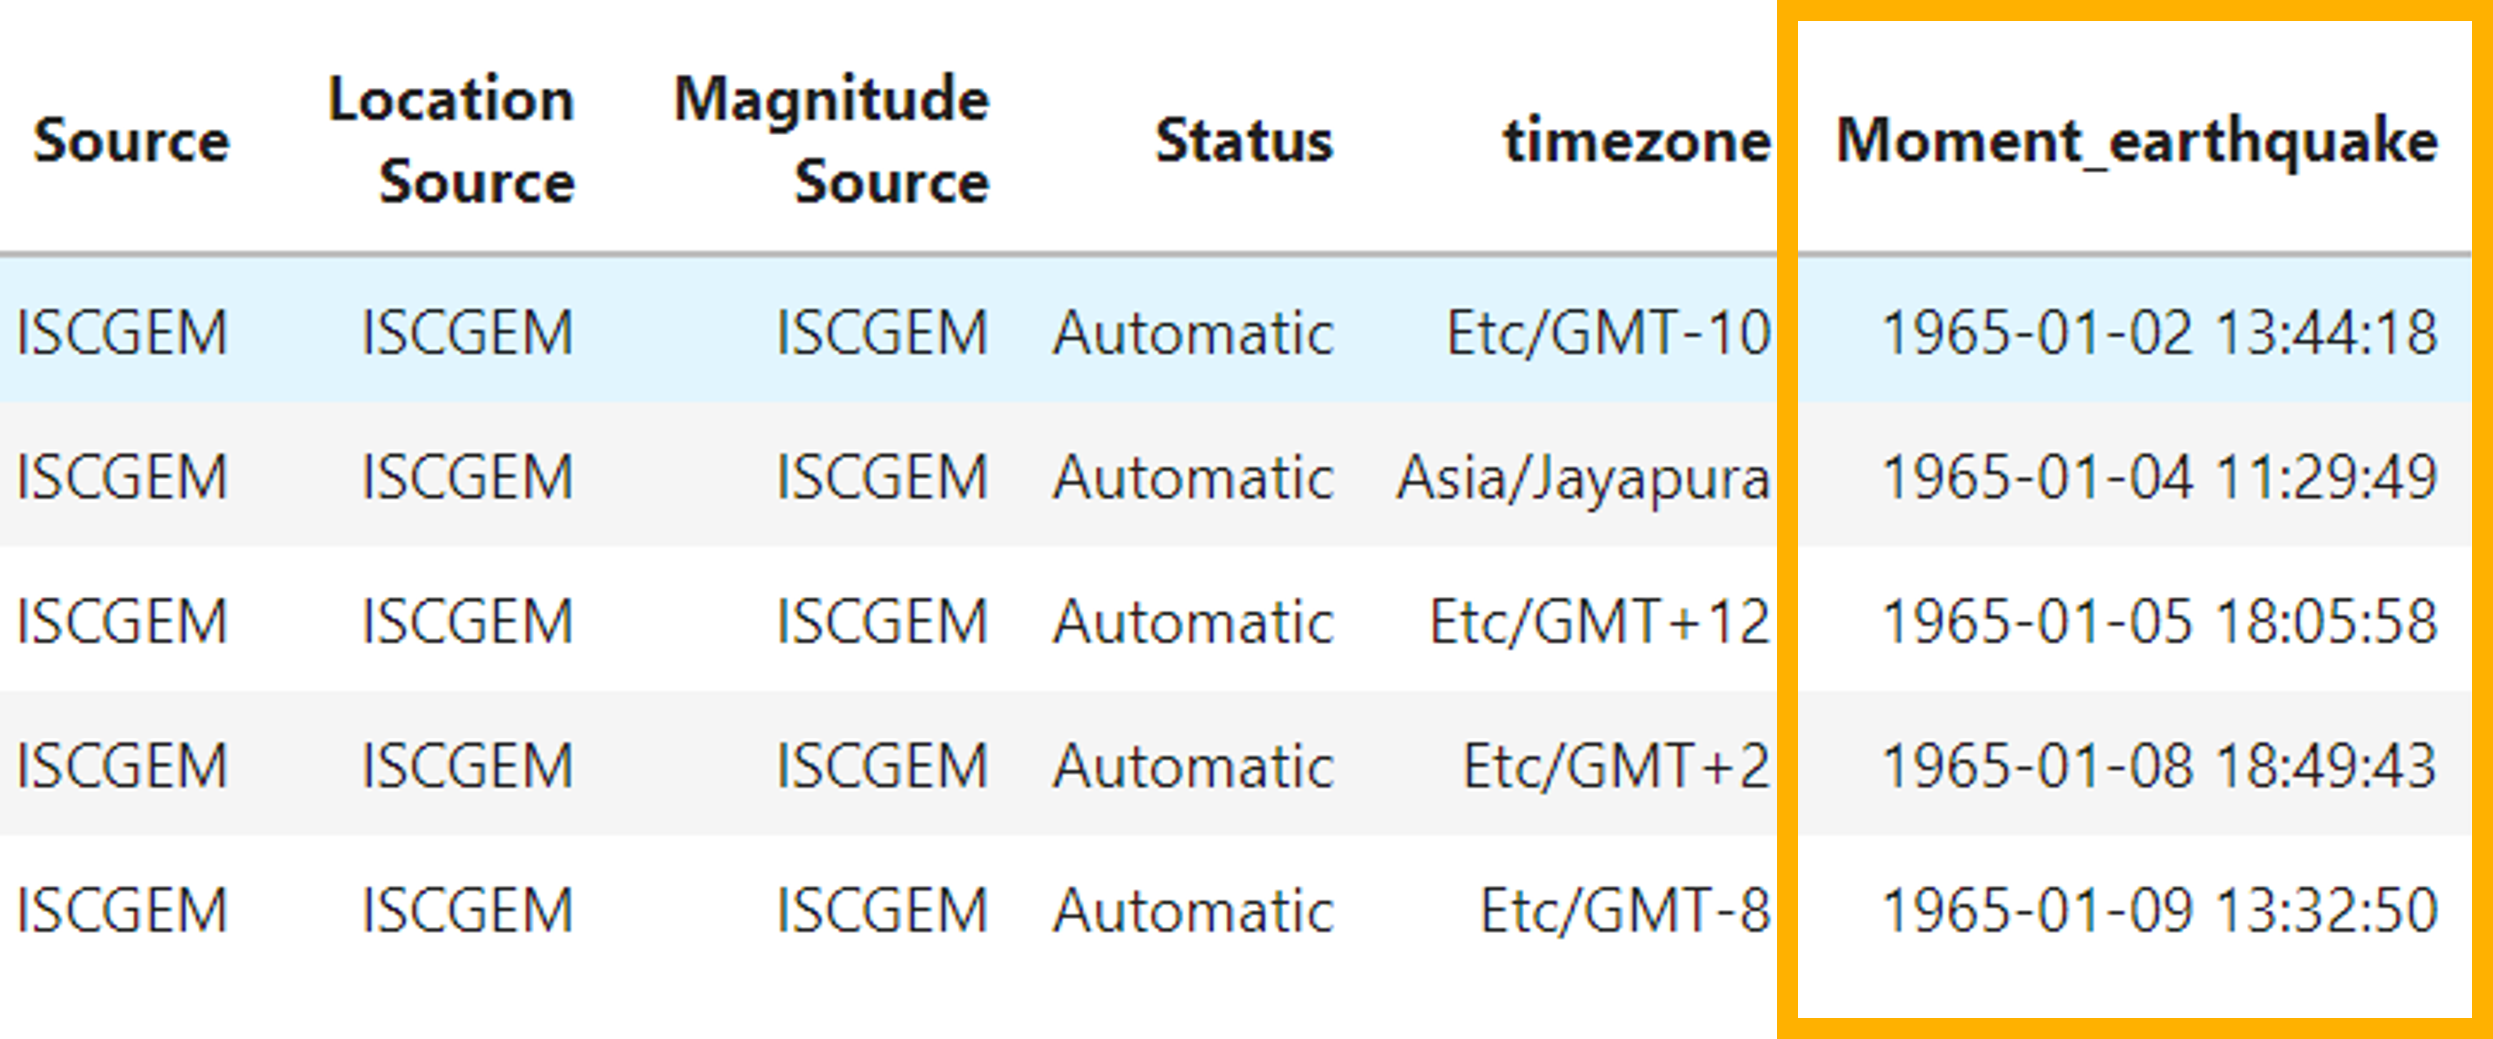
The next step is to merge the date and time because it is the way that we can use it to make calculations in the following steps. This process is easy. First, create a variable merging the two columns and then add that output as a column in the original data frame using pandas.
					#Create variable with the two columns
date_and_time = df['Date'] + " " + df['Time']
#Use pandas to add a new column with the above output
df['Moment_earthquake'] = pd.to_datetime(date_and_time)
Data Manipulation
Our data is ready to start working on it. Before the data manipulation process, it is essential to validate that the data type of the variable of our interest is in the correct format.
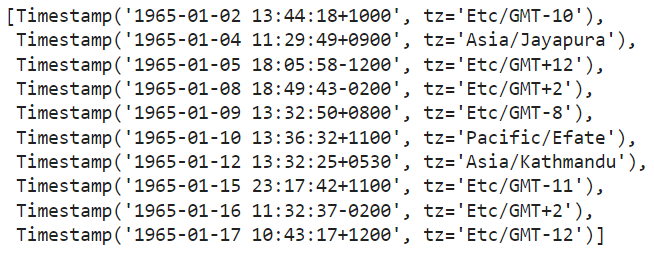
To see what the first date of the Moment_earthquake looks like, we can use iloc: df[‘Moment_earthquake’].iloc[0] the output must be Timestamp(‘1965-01-02 13:44:18’). The timestamp is the pandas’ equivalent of the python DateTime object, so we are in the right way.
We can improve the previous output by adding the timezone. To do that, we can use the tz_localize function and use iloc for the first row in the timezone column: df[‘Moment_earthquake’].iloc[0].tz_localize(df[‘timezone’].iloc[0]) as a result, the output must be Timestamp(‘1965-01-02 13:44:18+1000′, tz=’Etc/GMT-10’). Now, we have the date, time, and time zone for the first record. However, there is something else in the output. The “+1000” means that the time reported in this first record is 10 hours away from the universal time UTC.
Now we need to do that for all our records. This can be made easy using for loop. Let’s also see the first ten records:
					# Create time zone aware objects for all records.
# Obtain the relevant offset values and time zones for each record
list_momentearthquake = []

#Create a foor loop to repeat the process for each Moment_earquake in the dataset
for i in range(len(df)):
    list_momentearthquake.append(pd.to_datetime(df['Moment_earthquake'].iloc[i].tz_localize(df['timezone'].iloc[i], ambiguous='raise', nonexistent='raise')))

# The raise value allows us to obtain a message indicating an exception if a certain condition has not been met

#Check the first 10 records
list_momentearthquake[:10]
We are ready to create a new column calculating the hour offset UTC with the above information. Remember, this value means how many hours away the time zone of that record is from the universal time UTC.
					#Create a new coulm getting the hour Off set UTC
df['OffsetUTC'] = [list_momentearthquake[i].utcoffset().total_seconds() / 3600 for i in range(len(df))];
Data Analysis
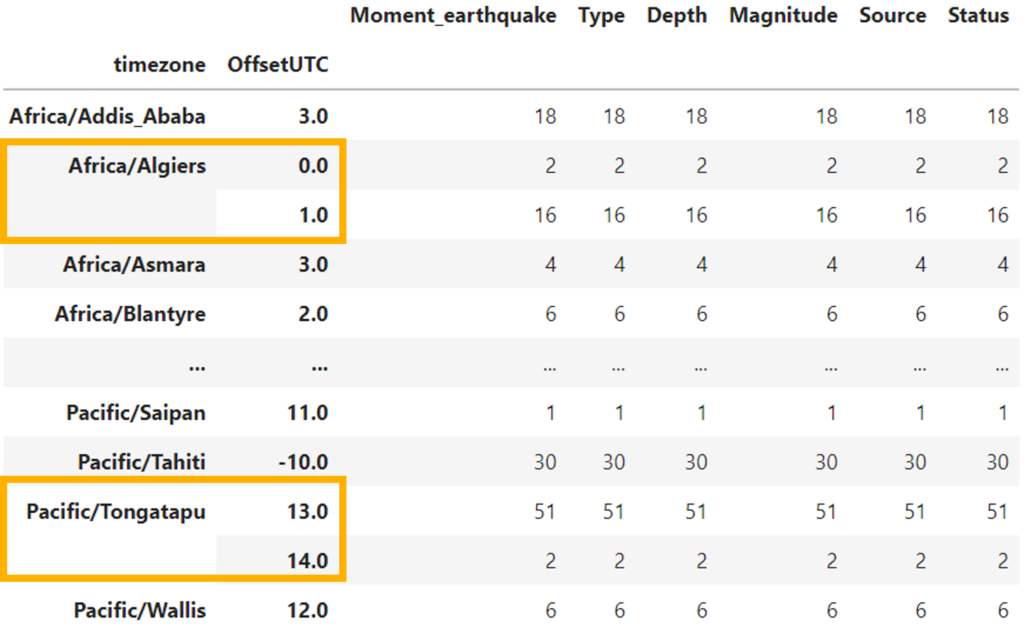
First, let’s see how the offset UTC by time zone is. To do that, we need to group the table by time zone and OffsetUTC. (output in the right)
According to the result, it can be seen that there are time zones with different OffsetUTC; for example, Africa/Algiers has two records in OffsetUTC 0 and 16 in OffsetUTC 1. Something similar happens with Pacific/Tongatapu.
This is possible, considering that depending on the year’s season, the local time can change in some countries.
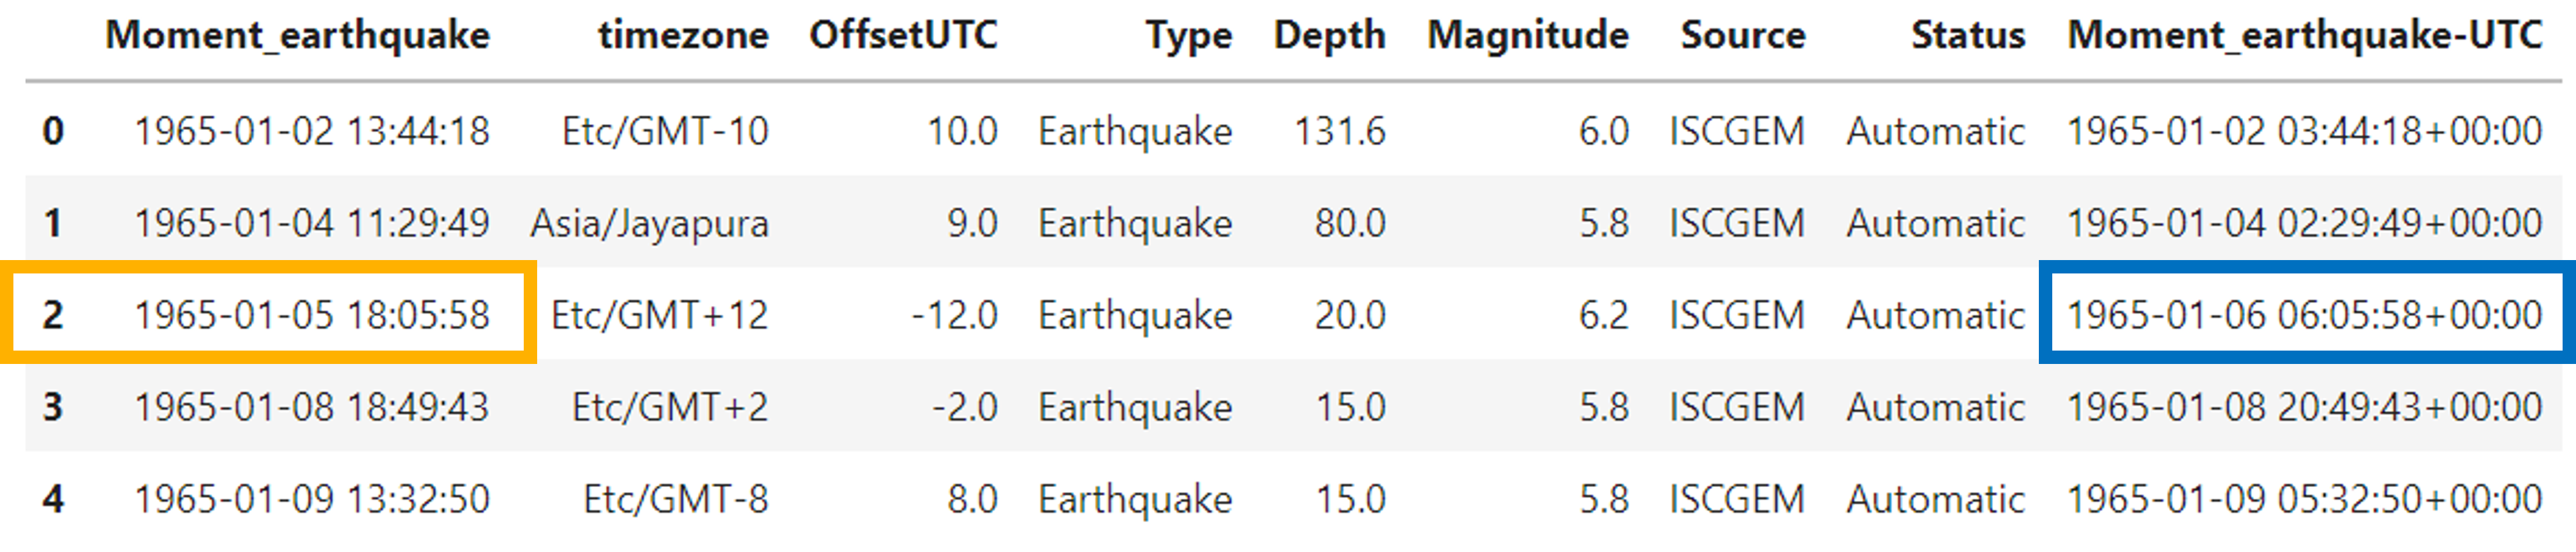
Now we have in our data set the time zone for each record and also the OffsetUTC. Remember our goal is to analyze the data with the Universal Time (UTC), which means that the last step we need to do is to convert the timezone to UTC:
					df['Moment_earthquake-UTC'] = [pd.to_datetime(df['Moment_earthquake'].iloc[i]).tz_localize(df['timezone'].iloc[i]).tz_convert('UTC')
                        for i in range(len(df))]
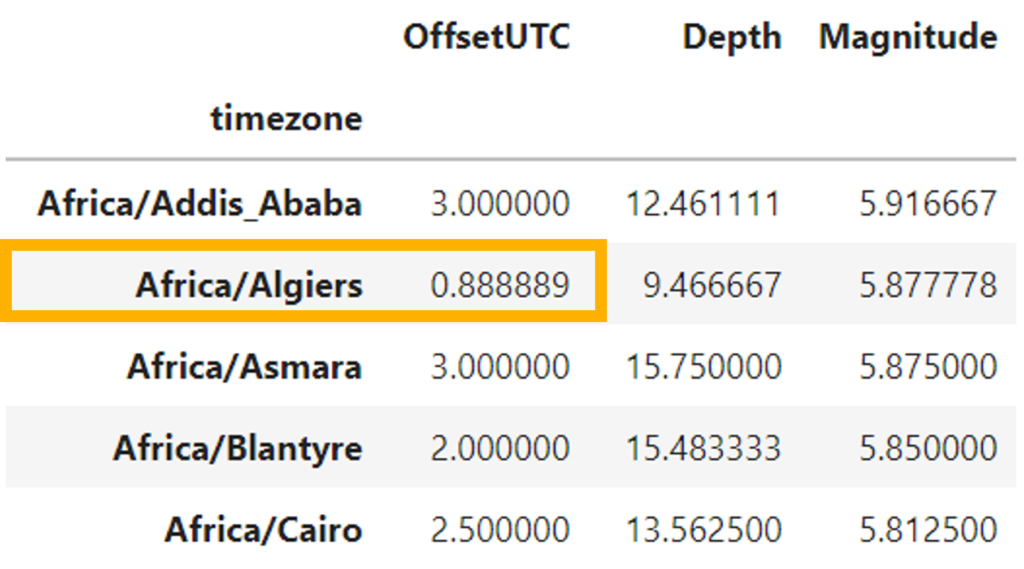
Finally, we can create a summary table that answers the question What is the average depth and magnitude of earthquakes by time zone?
We can create a table grouping by timezone and calculate the mean of depth and magnitude.
Note that some OffsetUTC, after applying the mean, is not integers because there are several hours in that time zone according to the year’s season.
Data Visualization
For the visualization, I used polar coordinates to illustrate the highest average earthquakes in depth and magnitude. The bigger the bar, the more depth the quake, and the darkest the bar, the higher the magnitude.
The plot shows that the time zone America/Rio_branco has the highest average earthquake in-depth, and America/Asuncion has the higher average earthquake in magnitude.
To see the complete code used for the analysis and the visualization, please visit my account on GitHub here.