Exploring the Gameplay Dynamics of League of Legends:
A Data-Driven Analysis of St. Clair College's Esports Team Performance
This project was collaboratively developed by Farzin Valiloo, Maryam Aliakbari and Harold Espinosa.
Introduction
Esports has become a rapidly growing industry, with millions of players worldwide competing in various games, including League of Legends. Understanding player behavior and performance is essential for improving the gaming experience for players of all skill levels. Data analytics plays a critical role in identifying areas for improvement, such as matchmaking, balance changes, and in-game features, making it a valuable tool for game developers.
The objective of this project is to conduct a thorough data-driven analysis of St. Clair College’s esports team’s performance in League of Legends. By utilizing data from game logs, the project aims to identify patterns and trends in player behavior and provide valuable insights into the behavior and performance of St. Clair College’s League of Legends team.
League of Legends, the game being analyzed in this capstone project, holds a prominent position in the competitive and professional world of esports. With millions of players worldwide and annual prize pools exceeding millions of dollars, League of Legends has emerged as one of the most popular esports games in the industry.(Gaina & Nordmoen, 2018) The game’s complexity, with its multitude of champions, items, and strategies, makes it a fascinating subject for data-driven analysis.(Activeplayer.io, 2023)
In a game as complex as League of Legends, data analytics can play a crucial role in identifying trends and patterns in player behavior and performance.(League of Legends Wiki, 2023a, 2023b) By analyzing data generated during gameplay, valuable insights can be gained into player performance, which can then be used to develop effective strategies for future competitions.
The scope of the project includes analyzing the data generated by the St. Clair College’s esports team playing League of Legends. The project aims to examine the key performance indicators and trends in player behavior and performance in the solo que matches (non-professional but daily played matches help players practice and develop their skills). The findings of the analysis will be presented in an interactive dashboard, featuring key performance indicators and visualizations, to facilitate easy comprehension of the large amount of data.
Data Description
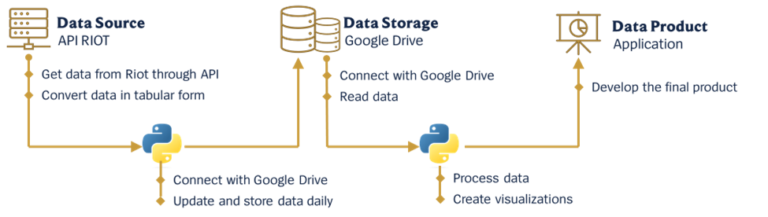
The game data used in this project was obtained through the game’s API using Python. The data is extensive, consisting of over 20 tables and 1000+ columns. However, because the amount of data that can be called from the API is limited, it was decided to store it in Google Drive. The flow of the data is illustrated in Figure 1. The two most important tables are the “generalstats” and “gameinfo” tables. The ” generalstats ” table provides insight into the statistics of each champion selected by the players throughout the game. It includes a snapshot of each player’s stats, such as their armor, gold earned, and other key metrics every minute for each match played. These stats are important in understanding the player’s strategy, progress, and playstyle.
The “gameinfo” table contains information about the end game result and achievements of the players after the game has ended. It provides individual player progress and achievements at the end of the game, such as the number of enemy champions killed, or towers destroyed. Each player has one row of information per match in this table.
Lastly, the “generaldata” table serves as a reference table that contains general information about the matches, including the start time, type of match, duration, and more. This table will be used as a reference when assessing data in the first two tables.
Dashboard development process
The dashboard development process involved several key steps, starting with the identification and derivation of metrics from the available data sources. This required a thorough analysis of the data, including game statistics and player profiles, to identify the most relevant metrics for tracking the performance of the college’s League of Legends team members in the solo queue.
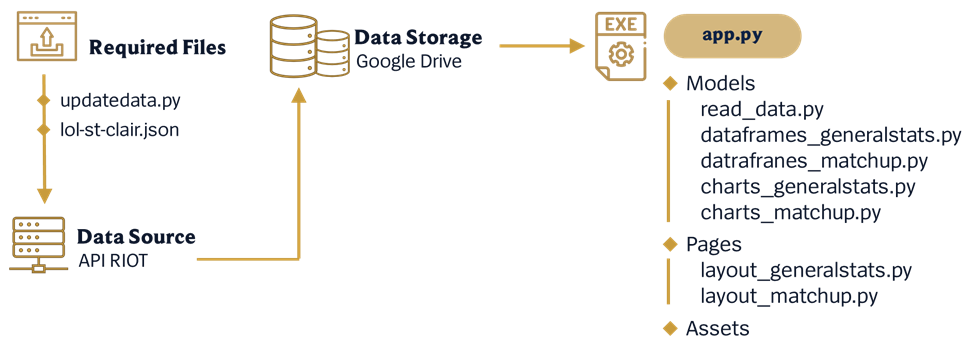
Once the metrics were identified, the team created various programming libraries and tools to help with data processing and analysis. These included ready_data, dataframes_generalstats, and other classes and methods, which were designed specifically to meet the needs of the project.
Using these custom libraries, the team was able to create an appropriate visual representation of the data, including charts, graphs, and other visual aids, to help users quickly and easily understand the performance metrics.
The team used the Dash library of Python to create the dashboard layout, which allowed for the development of a highly interactive and customizable user interface. Additionally, graphical assets such as CSS frameworks were used to enhance the overall appearance and user experience of the dashboard.
Throughout the development process, validation and feedback were critical components. Stakeholders, including League of Legends players, coaches, and data analysts, were consulted to ensure that the dashboard met their needs and provided valuable insights into team performance. This feedback was used to refine and finalize the dashboard, resulting in a powerful tool for tracking and analyzing the college’s League of Legends team members’ performance in the solo queue.
All code was written in an object-oriented manner to ensure efficient and scalable implementation. The custom libraries and programming techniques created by the team were essential to the success of the project, as they allowed us to effectively manage and analyze large amounts of data and create a user-friendly dashboard for visualizing team performance metrics.
Result
In this project, we successfully created a dashboard that effectively presents data in a user-friendly manner. The dashboard includes various charts and graphs that provide insights into key performance indicators (KPIs) related to the players’ gaming performance. Through the dashboard, users can easily analyze trends and patterns in the data, enabling them to make data-driven decisions. The dashboard is also interactive, allowing users to filter and drill down into specific data sets.
Overall, the dashboard has been well received by the stakeholders. We believe that this project has successfully achieved its objective of creating a valuable tool for data analysis and decision-making for the college’s League of Legends team and helping them to make decisions in a more accurate and timely manner.
Glossary
APIs: APIs stands for “Application Programming Interfaces” which are a set of protocols, routines, and tools used to build software applications. In this project, APIs were used to retrieve data from Riot Games’ servers to display in the performance tracking dashboard.
Baron: Baron is a powerful neutral objective in the game League of Legends. Killing Baron grants a team a significant buff that can help them push to victory.
Blue side: Blue side is one of the two teams in League of Legends. It refers to the team that spawns in the bottom-left corner of the game map.
Champion: A champion is a playable character in the game League of Legends. Each champion has unique abilities and attributes.
Creep Score (CS): Creep Score is the number of minions a player has killed in the game. It is an important metric used to measure a player’s ability to farm gold.
CSS frameworks: CSS frameworks are pre-prepared software frameworks that are meant to allow for easier, more standards-compliant web design using the Cascading Style Sheets language. In this project, a CSS framework was used to style the performance tracking dashboard.
Dragon: Dragon is a neutral objective in the game League of Legends. Killing Dragon grants a team various buffs that can help them push to victory.
Gold: Gold is the in-game currency used to purchase items and improve a player’s stats. Gold is earned by killing minions, monsters, and enemy champions.
Google Drive: Google Drive is a cloud storage and file synchronization service developed by Google. In this project, Google Drive was used to store data and files related to the performance tracking dashboard.
KDA: KDA stands for “Kill/Death/Assist” and is a metric used to measure a player’s performance in the game. It is calculated by dividing a player’s total number of kills and assists by their total number of deaths.
Kill Participation (KP): Kill Participation is the percentage of kills in which a player was involved in. It is an important metric used to measure a player’s impact on the game.
Player: A player is an individual who plays the game League of Legends.
Red side: Red side is one of the two teams in League of Legends. It refers to the team that spawns in the top-right corner of the game map.
Riot Games: Riot Games is the developer and publisher of the game League of Legends.
Solo queue: Solo queue is a matchmaking mode in the game League of Legends where players play individually to climb the ranked ladder.
Vision Score: Vision Score is a metric used to measure a player’s ability to place and clear wards. Wards are items that provide vision of an area and are used to gain information on enemy movements.
Appendices
The code files are in a private repository on Github. They can be shared upon request.